The Digital Platform for Consulting the Tree Inventory of Chapultepec Forest is the result of work carried out across several research projects, through which an inventory and assessment of the trees located in the designated zones/sub-zones of each section was conducted. These projects also included the diagnosis and characterization of each area, which made it possible to produce not only the corresponding reports, but also the tree management programs.
In carrying out the projects, methodologies grounded in scientific procedures from the fields of forestry, urban silviculture and arboriculture, urban ecology, parasitology, and forest and tree species phytopathology were used, supported by the appropriate and necessary statistical tools required for each study.
It is important to highlight that inventories are the fundamental procedure that makes it possible to understand the characteristics and condition of the tree populations. They provide the basis for determining the management of urban wooded areas so that they can deliver the diverse and essential environmental services that benefit both city residents and the urban environment, including:
Through the research projects, it was possible to quantify the environmental services provided by the trees in the studied sub-zones of Chapultepec Forest, as well as the economic value of those services—parameters that had never before been determined for the urban tree canopy of any city in Mexico. This was achieved using the i-Tree Eco México Digital System, recently adapted to the conditions of more than 30 cities in our country.
By consulting this page, you will be able to access information on the economic contribution of the environmental services calculated for each tree, as well as for each sub-zone and zone of Chapultepec Forest, through the corresponding interactive maps for each area.
Finally, it is important to highlight that this tree-inventory consultation platform for Chapultepec Forest is the first of its kind in Mexico. To date, no similar system has been developed for any urban green area in the country. It will undoubtedly be of great interest to visitors of Chapultepec Forest and to anyone interested in tree species, as well as to specialists in urban arboriculture and silviculture, biology, forest engineering, environmental economics, and landscape architecture, among others.
A T E N T A M E N T E
Dr. Héctor Mario Benavides Meza
Lead Researcher
Project Lead
INIFAP / CENID-COMEF

Additionally, complementary variables required by the i-Tree Eco Program were recorded for each tree, following the system’s manual (i-Tree, 2017), in order to estimate parameters for the quantification and valuation of the environmental services provided by the trees. These included: live crown height, crown light exposure (qualitative), percentage of missing foliage in the crown, estimated percentage of crown length with dieback (when present)
In addition to the above, the following activities were carried out:
3. Characterization Assessment of Zones and Sub-zones: A grid of sampling stations was established using a digital image of the different sections. The stations were systematically placed at intervals of 100 m, following the methodology defined by Benavides (2015). Each sampling station covered an area of 500 m², defined by a radius of 12.56 m from a central tree, and they were georeferenced and numbered consecutively.
At each station, the following activities were carried out according to the methodology defined by Benavides (2015):
Assessment of the condition of the tree stand and its horizontal structure through the recording of the following variables or parameters:
Assessment of the visual quality of the site through the recording of the following variables
4. Office Work: The information recorded in the field was entered into a database, and the corresponding calculations were performed, including average values, percentage values, relative and absolute frequencies, correlations between variables, as well as diversity and dasometric indices (proportion of basal area and crown cover in relation to total surface area).
The analysis and synthesis of this information, together with the results derived from soil and foliage analyses, made it possible to prepare the documents committed to the Chapultepec Forest Directorate, develop an internal tree-management system, and create the consultation platform.
5. Valuation and Quantification of Environmental Services (i-Tree Eco México): The information required for the application of the i-Tree Eco México program was specifically completed for the study site, including location and geographic coordinates, total area and permeable (green) and impermeable surfaces, as well as land-use type (roadway or green area).
The inventory database was adapted for entry into the i-Tree Eco México program in order to perform the analysis. With the support of the program, structural parameters of the tree population were estimated, including species frequency and importance values, diversity indices, leaf area and biomass, tree condition, and potential risk of pests and/or diseases. Functional parameters of the urban forest were also estimated, such as: total carbon storage and annual carbon sequestration rate, amount of pollutants removed per hour (O₃, NO₂, SO₂, CO, and PM₁₀), and estimated annual pollutant removal percentage; amount of runoff controlled by stratum and for the most frequent tree species; hourly emissions of volatile organic compounds (VOCs) at the genus or species level; and the economic value of the environmental services provided by the trees, including a cost-benefit analysis.
Using the i-Tree Eco México program, short-term forecasts (5 years) were generated for annual tree mortality, pollutant removal, and carbon storage and sequestration by the tree population.
A T E N T A M E N T E
Dr. Héctor Mario Benavides Meza
Lead Researcher
Project Lead
INIFAP / CENID-COMEF
Literatura citada
Benavides, M. H. M. 2015. Metodología para el diagnóstico de áreas verdes urbanas e inventario de su arbolado. Libro Técnico No. 8. CENID-COMEF, INIFAP. México, D.F. México. 114 p.
i-Tree. 2017. i-Tree Ecov6 Overview. i-Tree, Tools for Assessing and Managing Forest & Community Trees. Disponible en: https://www.itreetools.org/eco/index.php# (05 de julio de 2017).

The Digital Consultation Platform for the Tree Inventory of Chapultepec Forest is the result of several research projects carried out by the Urban Silviculture Research Group, coordinated by Dr. Héctor M. Benavides Meza, a researcher at the National Research Center for the Conservation and Improvement of Forest Ecosystems of the National Institute for Forestry, Agriculture, and Livestock Research (INIFAP).
The research projects that made it possible to obtain the information presented on the platform for the 1st, 3rd, and 4th sections were conducted thanks to resource management by the ProBosque de Chapultepec Trust, the allocation of funds to the Chapultepec Forest Directorate by the Environmental Secretariat of Mexico City (2012–2018), and, in the final phase, by the then National Council of Science and Technology (CONACYT). Regarding the results presented for the 2nd section, funding has been provided by the ProBosque de Chapultepec Trust, and it is expected that the Environmental Secretariat and other institutions will soon contribute to completing this section.
The quantification and determination of the economic value of the environmental services provided by the tree masses were carried out using the i-Tree Eco México Digital System, adapted several years ago to the environmental conditions of more than 30 cities in Mexico, thanks to the support of the Office of International Programs of the United States Forest Service (USFS).
It is important to highlight that this system was developed by USFS researchers and later expanded and improved with the support of various U.S. institutions and organizations, including The Davey Institute of the Davey Tree Expert Company, and is freely available (https://www.itreetools.org/eco/).
In addition, the platform was created using the QGIS Geographic Information System (https://www.qgis.org/en/site/
), which is open-source and free to use. Together with OpenStreetMap (https://www.openstreetmap.org/
), also open-source and free, these tools made it possible to visually present the information collected through the inventory, assessment, and quantification–valuation of the environmental services provided by the forest’s trees.

In this section, the way to access the information provided by the Digital Platform for each section and its corresponding sub-zones is presented.
For the explanation, the 1st section is used as an example; however, the access and display of information for the 2nd, 3rd, and 4th sections of the forest are exactly the same in each case.
We also recommend consulting the GLOSSARY, which can be accessed from the welcome page of this platform.
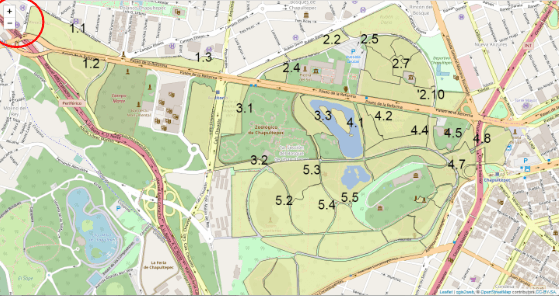
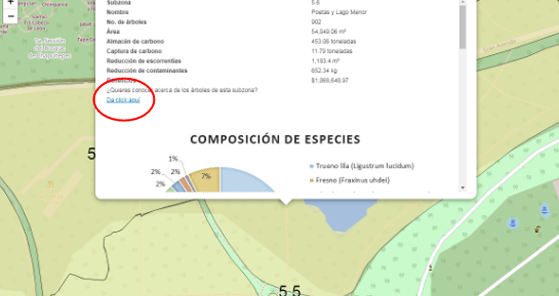
When entering any of the sections, you will see an initial screen showing the sub-zones that make up that section of the forest, identified by their corresponding sub-zone number (e.g., 1.2) (Figure 1). You can zoom in on a sub-zone number using the mouse wheel or the left panel commands (+, –), shown inside the red circle
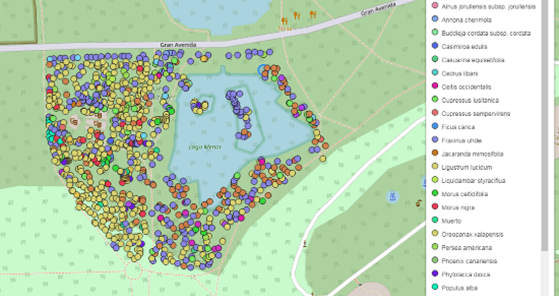
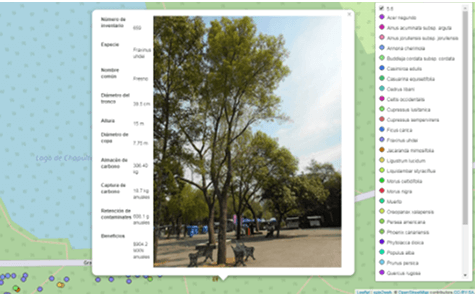
Para seleccionar un árbol (punto de color) se recomienda que se haga un acercamiento de la misma manera que se mencionó anteriormente y al dar click, se desplegara un nuevo recuadro, en la que se verá la fotografía del ejemplar y la información del árbol de acuerdo a lo que se menciona a continuación (Figura 8):
Seguramente esta información te facilitará el uso de la Plataforma Digital de Consulta del Arbolado del Bosque de Chapultepec, con la cual podrás conocer con mayor detalle, este valioso recurso natural con que cuenta nuestra ciudad, en el área verde urbana más importante y de mayor trascendencia de México.
Carbon Storage: Amount of atmospheric carbon that is stored in the trunks, branches, and leaves of trees, forming plant tissues such as wood.
Carbon Sequestration: Amount of atmospheric carbon that is fixed or retained annually by trees in their trunks, branches, and leaves through the process of photosynthesis.
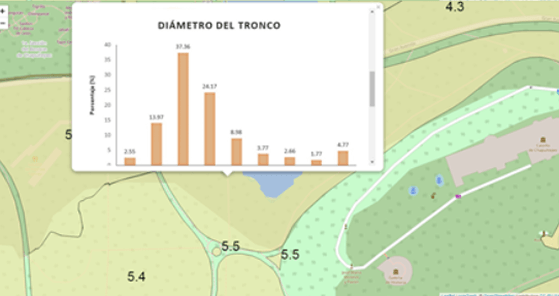
Trunk Diameter: Distance measured across the trunk from one side to the other, taken at a height of 1.30 m above ground level.
Crown Diameter: Average width of the tree crown.
Species: Scientific name of the tree. The first part is the genus (e.g., Fraxinus), and the second part is the specific epithet (e.g., uhdei). Each species has only one correct scientific name (Fraxinus uhdei), which must be written in italics.
Runoff Reduction: Amount of rainfall intercepted by the tree canopy that contributes to reducing surface runoff (Hirabayashi, 2013).
Pollutant Removal (Air Quality): Amount of ozone (O₃), nitrogen dioxide (NO₂), sulfur dioxide (SO₂), carbon monoxide (CO), and fine particulate matter smaller than 2.5 microns (PM₂.₅) removed or retained by the tree canopy over one year (Hirabayashi, 2016).
Environmental Services: Natural processes carried out by living organisms (plants or animals) that benefit humans. In the case of urban trees, these services help improve the quality of life for city residents.
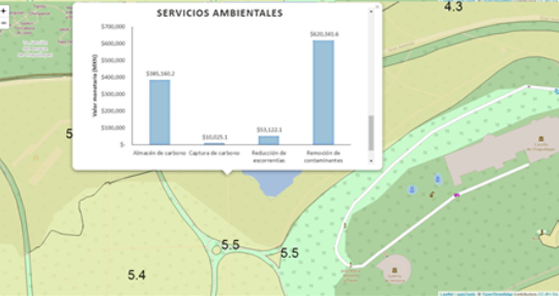
Environmental Services Value (Env. Serv. Value):
Monetary estimate of the economic value of the environmental services generated by the tree population within a specific area, such as each of the sub-zones that make up Chapultepec Forest.
References
Hirabayashi S. 2013. i-Tree Eco Precipitation Model Descriptions. i-Tree, Tools for Assessing and Managing Forest & Community Trees. Forest Service, United States Department of Agriculture. 19 p. Available at:
https://www.itreetools.org/eco/resources/iTree_Eco_Precipitation_Interception_Model_Descriptions.pdf (October 31, 2018).
Hirabayashi S. 2016. Air Pollutant Removals, Biogenic Emissions and Hydrologic Estimates for i-Tree Applications. i-Tree, Tools for Assessing and Managing Forest & Community Trees. Forest Service, United States Department of Agriculture. 19 p. Available at:
https://www.itreetools.org/landscape/resources/Air_Pollutant_Removals_Biogenic_Emissions_and_Hydrologic_Estimates_for_iTree_v6_Applications.pdf

Cargando formulario...
Cargando formulario...
Cargando formulario...